Home / Articles / Detail

Economic and Energy Outlook of Japan through FY2018

Energy Outlook of Japan

AOSHIMA Momoko, Y. Yorita, M. Tsunoda, H. Arimoto, C. Onda, Y. Shibata, A. Yanagisawa, S. Suehiro, K. Taguchi and K. Ito

Highlights

Macro economy | Japanese economy through FY2018 grows by more than 1.0% for four consecutive years

Firm growth in both domestic and foreign demand in FY2017 supports the expansion of the Japanese economy by 1.4%. Although the export expansion will slow down in FY2018, a strong domestic demand will maintain a GDP growth of 1.1% for that period. The Japanese economy will experience over 1.0% growth for four consecutive years for the first time since FY2003 to FY2007.

Primary energy consumption | Total primary energy consumption declines mainly because of decreasing use of fossil fuels. Japan’s self-sufficiency ratio exceeds 10% for the first time since the Great East Japan Earthquake.

In spite of expanding economic activities, total primary energy consumption in FY2017 slightly decreases by 0.1% due to continued energy conservation efforts. Primary energy consumption in FY2018 will decline by 0.6% from the preceding year; the stronger decrease reflects lower growth in economic activities. Fossil fuels consumption will decrease by 17 Mtoe for the projected years with the restart of nuclear power plants and increased generation from renewable energy. Energy-related CO2 emissions reached their highest level in FY2013 and have been continuously decreasing ever since (FY2017: -2.0%, FY2018: -1.6%). Japan’s self-suff iciency ratio exceeds 10% for the first time since the Great East Japan Earthquake.

Energy sales | Electricity increases and city gas continues at historical high levels, while fuel oil declines.

In FY2017, electricity sales increase mainly due to rising sales to industry associated with the expanded production activities. In FY2018, electricity sales will remain almost flat (FY2017: 0.4%, FY2018: 0.0%). City gas sales reach record high levels for the third consecutive year, mainly because of rising sales to general industry due to the production/economic activities and exploiting new demand (FY2017: 1.0%, FY2018: 0.6%). In FY2017, total fuel oil sales decline by 1.6% due to less heavy fuel oil C required for power generation caused by the return of nuclear power plants and fuel switching. In FY2018, fuel oil sales will continue to decline (-1.7%), reaching levels below 70% of their peak.

Nuclear power generation | 10 nuclear power plants are assumed to restart by the end of FY2018, decreasing the electricity unit cost by JPY300/MWh.

A total of five nuclear power plants are now operating in Japan with units 3 and 4 of the Takahama nuclear power station restarting operation. Another seven units have already met the new regulation standards and are being prepared for re-operation. If a total of 10 units are in operations by the end of FY2018, total spending on fossil fuel imports would decrease by JPY500 billion compared to the case where none of the units are in operation. With 10 units in operations (compared to none), real GDP expands by JPY500 billion, the self-sufficiency ratio increases by 2.9 point and energy-related CO2 emissions decline by 2.7%. Nuclear power generation clearly contributes to the improvement of the 3Es (economy, energy security, and environment).

In-depth analysis | Demand trend of diesel oil

Among fuel oils, demand for diesel oil is the third largest after gasoline and naphtha; it is consumed in a wide range of fields. Diesel oil is also the only major fuel oil that increased in consumption compared to FY2010, the year before the Great East Japan Earthquake. It is now declining through FY2018 but at more moderate pace compared to other fuel oils (FY2017: -0.6%, FY2018: -0.6%). The share of diesel oil in total fuel oil sales expands from 16.8% in FY2010 to 19.3% in FY2018.

Executive summary of outlook through FY2018 [Reference Scenario]

Macro economy

The Japanese economy will grow at 1.4% in FY2017 because of favourable private consumption expenditure and strong exports supported by overseas economic growth. Despite a slowdown in exports in FY2018, the economy will continue to grow at 1.1% due to firm growth in domestic demand greatly influenced by Tokyo Olympic Games-related investment. Although growth keeps over 1% for four consecutive years through FY2018, it seems to be far from the Government’s target of a nominal GDP of JPY600 trillion.

Production activities

Since the exports of electric machinery grow alongside with the moderate restoration of overseas economy, the significant recovery of general and electric machinery production has a huge contributing factor to the overall production activities in FY2017. Also, the urban redevelopment and infrastructure construction for the Tokyo Olympics are among the contributing factors to the overall production activities. Production activities continue to enlarge in FY2018, although at a more moderate pace than the preceding year. Ethylene production declines as maintenance of plants increases relative to the previous year and as the competition for exports to China intensifies due to the operation of shale-derived ethylene plants in the United States.

Energy supply and demand

Although production and economic activities are growing, total primary energy supply in FY2017 declines slightly by 0.1% because of the continued advancement of energy efficiency. In FY2018, it decreases a little more (-0.6%) caused by more moderate production and economic growth than in the previous year. Oil dependence ratio falls to below 40% in FY2017, and the shift toward non-fossil fuels energy will continue to progress.

In FY2017, total final energy consumption in the industry sector increases slightly owing to expanded production activities (0.1%). The transport sector consumes less than in the previous year (-1.1%) due to an increase in the share of fuel-efficient cars. Consumption also decreases in the buildings sector (residential and commercial) mainly due to improvements in energy efficiency (-0.7%). Although overall production activities increase in FY2018, energy consumption in all sectors decreases. The industry sector’s consumption decreases by 0.5% from the previous year, due to a consumption drop in naphtha for the petrochemical industry. Consumption in the buildings and transport sectors declines due to further advancements of energy efficiency (buildings: -0.8%, transport: -1.1%).

Energy sales

In FY2017, electricity sales augment slightly (0.4%), because increased sales to industry (0.8%) for the expanded production activities surpass the decreased sales for lighting contract and low voltage due to the improvement of energy efficiency. In FY2018, the total electricity sales remain flat as the increase of electricity sales for industry (high and extra-high voltage) slows down (0.3%), in line with the production activities moderate growth, while low voltage sales decrease because of facilities’ efficiency improvement (-1.1%).

Total city gas sales reach a record high level in FY2017. They increase by 1.0%, led by growing sales to general industry (2.1%) that continuously seeks demand development activities. Sales for domestic use increase by 0.2% also because of the constant demand development. Sales for commercial and other uses drop by 0.4% because of the diffusion of more energy-efficient equipments. In FY2018, overall sales will reach the highest record for a third conservative year. Sales will rise moderately compared to the previous year (0.6%), led by increase sales for industrial use, while sales for domestic use will remain flat and those for commercial and other uses decline.

In FY2017, fuel oil sales decrease for the fifth consecutive year. The decrease of 1.6% in FY2017 is caused by a huge decline in the use of heavy fuel oil C for power generation (due to the return of nuclear power plants) and a decline in sales of kerosene and heavy fuel oil A, B and C because of fuel switching toward electricity and city gas. In FY2018, sales of all fuel oils will be lower by 1.7% than the previous year for the sixth consecutive year. Naphtha for the petrochemical industry turns to the decrease.

Renewable power generation

With regard to renewable power generation, a rapid increase in approved capacity under the FIT program seems suppressed by a fall in the electricity price for solar PV and the cancellation of previously approved capacities but non-operated. If the expired capacities were excluded from the approved 94.6 GW capacity at the end of February 2017, 66.9 GW would be operated. In this case, the cumulative amount of consumer burden for twenty years will reach JYP45 trillion (including capacities which were introduced before FIT and included in FIT later). This is equivalent to a rise in electricity price of JPY2,600/MWh – 11% for the residential and 16% for the industry sector.

CO2 emissions

Energy-related CO2 emissions, which reached a historical high in FY2013, will decrease for a fifth consecutive year through FY2018. Energy efficiency, the restart of nuclear power plants as well as an increase in renewable energy will lower the emission to 1,113 Mt-CO2 in FY2017 and 1,096 Mt-CO2 in FY2018 (9.9% and 11.3% less than in FY2013, respectively). FY2018 will be below 1,100 Mt-CO2 for the first time in 25 years, except for FY2009 just after the Lehman shock.

Table 1 | Summary of the Reference Scenario
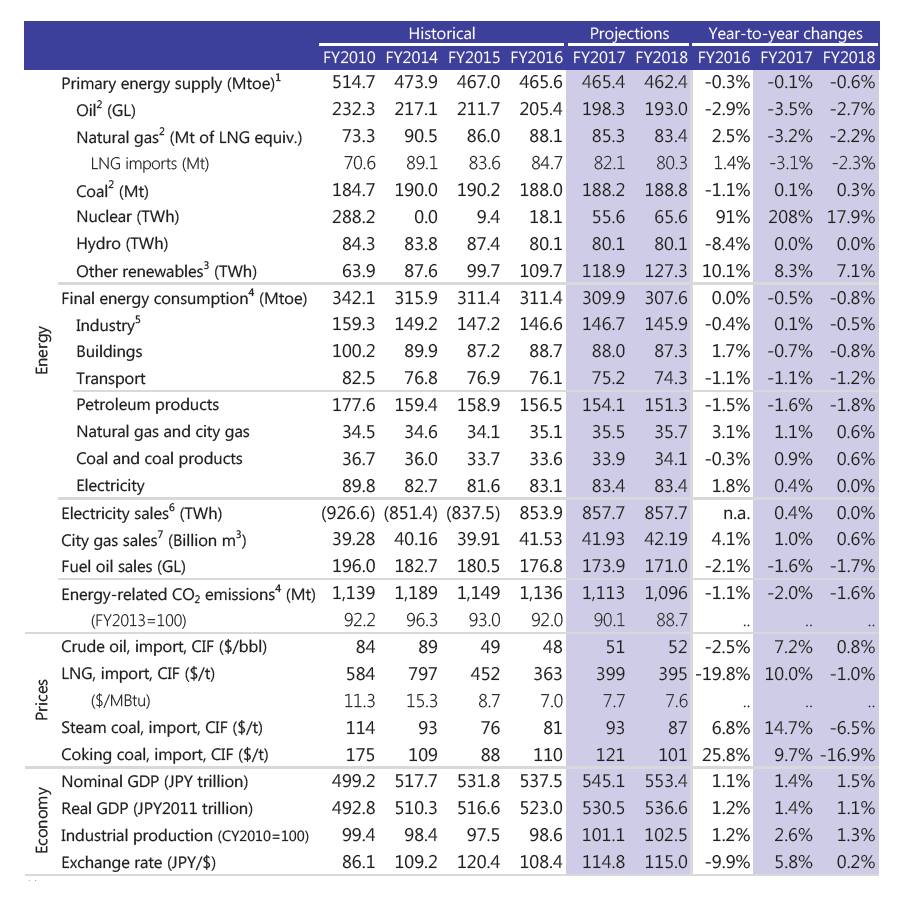
Summary of the Reference Scenario

Notes:
  1. Mtoe = 1013 kcal
  2. Conversion factors for Oil: 9,126 kcal/L; Natural gas: 13,043 kcal/kg; Steam coal: 6,139 kcal/kg; Coking coal: 6,928 kcal/kg until FY2012. Conversion factors for Oil: 9,145 kcal/L; Natural gas: 13,141 kcal/kg; Steam coal: 6,203 kcal/kg; Coking coal: 6,877 kcal/kg since FY2013.
  3. Excluding large hydro 30 MW or more
  4. Estimated actual value for fiscal 2016
  5. Industry includes non-energy use.
  6. Figures in parentheses are old statistical figures.
  7. Conversion factor: 1 m3 = 10,000 kcal

Executive summary of topics

Effect of the nuclear power plants’ restart

The Reference Scenario assumes that five more power plants will restart by the end of FY2018 in addition to the currently operating five plants, for a total of 10. Electricity generation from nuclear will reach 65.6 TWh, which represents a 7% share of the power generation mix. Electricity unit cost should decrease by JPY300/MWh compared to the Zero Operation Case, which assumes none of the nuclear power plants is in

operations. Relative to the Zero Operation Case, total spending on fossil fuel imports decreases by JPY500 billion, real GDP and self-sufficiency ratio expand by JPY500 billion and by 2.9 point respectively, and energy-related CO2 emissions decline by 30 Mt (2.7%).

In the Low Case, which assumes no new plants to restart by the end of FY2018, total electricity generation from nuclear is almost half of the Reference Scenario with a 3% share of the power generation mix. The contribution to the 3Es (economy, energy security, and environment) is also half of the Reference Scenario. On the other hand, the High Case assumes a total of 17 nuclear power plants to be in operation by the end of FY2018 with electricity generation from nuclear reaching 1.5 times of Reference Scenario level. The High Case represents a 10% share of the power generation mix, which is almost half of the share of 20% to 22% prospected in METI’s Long-term Energy Supply and Demand Outlook. Relative to the Zero Operation Case, electricity unit cost decreases by JPY500/MWh, and total spending on fossil fuel imports decline by JPY700 billion. Real GDP and self-sufficiency ratio expand by JPY800 billion and by 4.4 point respectively, while energy-related CO2 emissions decline by 45 Mt (4.0%). The pace of restarting nuclear power plants has a definite impact on the improvement of the 3Es.

Effect of the nuclear power plants

Note: Figures in parentheses are nuclear’s share in power generation mix.

If we try to achieve lower spending on fossil fuel imports (JPY700 billion) and CO2 emissions (45 Mt) as in the High Case by only electricity saving, a reduction of 100 TWh (equivalent to the decrease of electricity generation from FY2010 to FY2014) would be required. It, however, would be very difficult to reduce the electricity unit cost or increase the self-sufficiency ratio using electricity savings alone.

In-depth analysis <1> Demand trend of diesel oil

Diesel oil sales, which are relatively firm among fuel oils, decline at a rate of 0.6% per year during the period in review, while total fuel oils sales decrease by 1.7% per year. Diesel oil sales for transportation account for over 80% of total sales. Diesel oil use for freight among transportation decreases at an annual rate of 0.9%, far less than the decreasing pace for FY2016 of 1.4%. The advancement of fuel economy and energy savings in the transportation system are continuously acting as decreasing factors. On the other hand, the increase of home delivery service associated with expanded internet shopping and related demand for truck transportation are also important determinants of diesel oil demand. The number of home delivery service operation in FY2016 increased by 7% from the previous year, and is expected to grow through FY2018. These ease the pace of decreasing the volume of diesel oil sales.


By: IEEJ

SIEW 2025 Sponsors

SIEW 2025


In Celebration of

sgp-logo

Organised by

ob--ema

MICE_2024_WINNER1