AOSHIMA Momoko, K. Tomokawa, M. Tsunoda, Y. Yorita, K. Ueno, R. Eto, K. Jin , C. Onda, Y. Shibata, A. Yanagisawa, S. Suehiro, K. Taguchi and K. Ito
Executive Summary
Nuclear power generation | Pay attention to the restarts
Gradually, the passing of safety checks and the process of restarting under the new regulation standards is proceeding. And yet, there is still much ambiguity including judicial ruling and/or local acceptance which will influence the pace of restart. This paper analyses the influences on the 3Es (Economy, Energy Security, and Environment) of four cases of different levels of nuclear power units approval and restart by the end of FY2017.
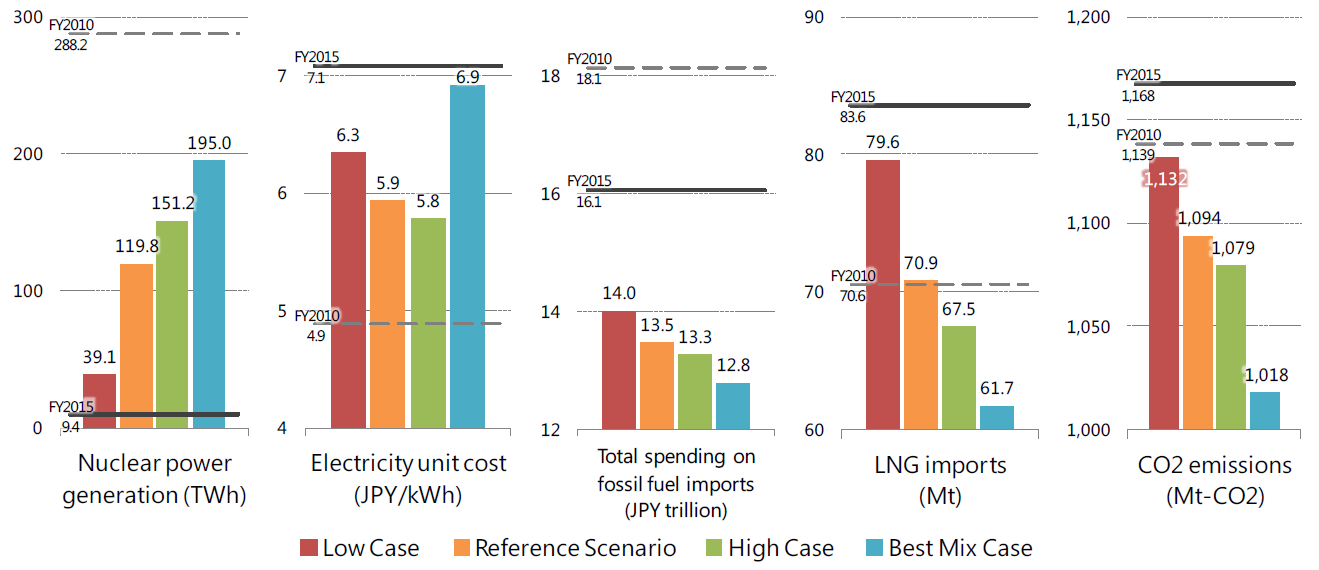
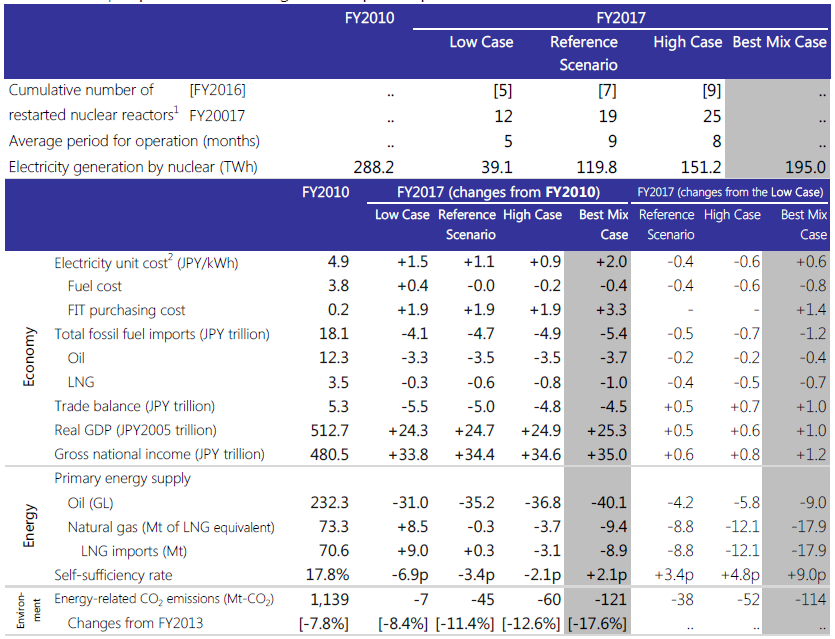
The [Reference Scenario] assumes that by the end of FY2016, a cumulative total of seven nuclear power units will have restarted and that by the end of FY2017, 19 units will be in operations. They will be in service during FY2017 with a total electricity generation reaching 119.8 TWh, which is 42% of the pre-earthquake FY2010 level. Compared to FY2010, total spending on fossil fuel imports decreases by JPY4.7 trillion, while the electricity cost (*) per kWh (i.e. electricity unit cost) rises by about JPY1,100/MWh. Relative to the same period, the energy-related CO2 emissions decrease by 45 Mt-CO2 (2.1%) and the self-sufficiency rate remains lower by 3.4% point at 14.4%.
-
Electricity Cost = Fuel cost + FIT + Grid Stabilization Cost Actual power tariffs include capital and labour costs (Source of definition: METI, [Long-term Energy Demand and Supply Outlook] May 2015)
In the [High Case], which assumes a total of 25 units to restart by the end of FY2017, total fossil fuel imports spending decreases by JPY0.7 trillion relative to the [Low Case] where only 12 units are assumed to restart. In this comparison, the average electricity cost is lowered by about JPY600/MWh, the self-sufficiency rate improves by 4.8% point and the energy-related CO2 emissions decrease by 52 Mt-CO2 (4.6%) whilst GDP increases by JPY0.6 trillion (0.12% point).
The hypothetical [Best Mix Case] reflects the generation mix of METI’s [Long-term Energy Supply & Demand Outlook]. Under this Case, compared to the [Low Case], total fossil fuel imports spending decreases by JPY1.2 trillion. In this comparison, the self-sufficiency rate is improved by 9.0% point and the energy-related CO2 emissions are decreased by 114 Mt-CO2 (10.1%). The average electricity cost is increased by JPY600/MWh, reaching JPY6,900/MWh, which is the highest among the four cases (but it is lower than the estimated JPY9,100/MWh based on the [Long-term Energy Demand & Supply Outlook] target).
Because of the judicial ruling that ceased operations at the Takahama Unit No.3 and 4, it is important to analyse the effect of stopping operations of nuclear power plants from a local point of view. As a rule, if one nuclear plant with the capacity of 1 MW stops operation for one year in an area where annual demand is about 100 TWh, total fossil fuel costs increase by JPY60 billion and the energy-related CO2 emissions increases by 4 Mt-CO2 (7% increase for the local emissions). The average electricity unit cost will increase by JPY400/MWh (1.8% rise of the average power unit price).
Figure 1 | Impacts of restarting nuclear power plants (FY2017)

Lower oil prices | Overview of the crude oil price influence on Japan
If the oil and LNG prices drop by $10/bbl and by $1.4/MBtu, they will contribute to the growth cycle for consumption and investment and Japan’s GDP will increase by 0.1% (JPY0.6 trillion). The improved trade balance brought by the decrease in total fossil fuel imports spending of JPY2.0 trillion is the main factor for GDP expansion.
A decrease in investment for energy resource development is feared to negatively influence the world economy. When crude oil prices dropped by $40/bbl in FY2015, world energy development investment decreased by JPY15 trillion and by JPY1 trillion in Japan, compared to FY2014
Looking at the influence of the lower oil prices on corporate prof its, oil companies reported almost JPY1.0 trillion loss of final prof it due to losses in inventory valuation and impairment related to resource development. On the other hand, increase in operating prof it through decrease of fuel costs and power tariff was much bigger at JPY2.0 trillion.
Executive summary of outlook through FY2017 [Reference Scenario]
Macro economy | FY2016 & 17: Japanese economy grows but slowly
The Japanese economy will continue to grow but more slowly in FY2016 at 0.7%. Private demand will slow down from the previous year while public and overseas demand will lead the growth. For FY2017, GDP grows at 0.9% for the period, led by private demand. Consumer spending will slow down slightly, while private investment will remain strong.
Energy supply and demand | Energy use continues to decrease but at a slower pace
Total primary energy supply in FY2016 decreases due to the slow recovery in domestic production of the manufacturing sector as well as the advancement of energy saving. Because of a continued economic expansion and other factors, the decline of energy supply of FY2017 will slow down. The restart of nuclear power plants and use of renewable energy will reduce the oil and natural gas consumption.
In FY2016, total final consumption decreases for the seventh consecutive year since the Great East Japan Earthquake. Industry sector’s consumption decreases because of reduced production including Ethylene. The transport sector consumes less due to an increased share of fuel-efficient cars while consumption increases in the residential and commercial sectors due to temperature effect. In FY2017, industry sector’s consumption will increase through gradual expansion of production activities while the consumption of the residential and commercial sectors will remain flat and the transport sector will consume less.
Energy sales | City gas and electricity grow and fuel oil declines.
In FY2016, electricity sales by utilities to households increase for the first time since the earthquake. This is because of the increase in cooling and heating demand as a rebound from the previous year’s cooler summer and warmer winter. Sales for power services increase for the first time in four years, reflecting growth in cooling and heating demand for commercial sector and better production and economic conditions.
City gas sales in FY2016 increase to 40.4 billion m3 due to demand development efforts and temperature effect despite a slow pace of production recovery in the manufacturing sector. In FY2017, sales to industry will increase reflecting the recovery of production activities. The overall sales will mark the highest-level for a second consecutive year.
Total fuel oil sales show an overall decrease in FY2016, primarily in response to a decline in Naphtha sales as well as a decline in the use of Type C fuel oil for power generation due to the return of nuclear power units. In FY2017, overall sales of fuel oil will decrease for the fifth consecutive year. It is because sales for Type C fuel oil for power generation will decrease, due to more re-starts of nuclear power stations, and because of the decrease in Gasoline and Kerosene sales.
Renewable power generation | Operational capacities will reach 65 GW. The cumulative cost burden could be JPY56 trillion
The pace of expansion for renewable power generating capacity of the last few years, supported by a generous Feed-in Tariff (FIT) system, is slowly subsiding due to reduced tariff for solar PVs and the cancellation of approvals for contracts/permits of some facilities, which have not started operation. Despite such situation, the operating capacity of renewable power generation (excluding large-scale hydro) by the end of FY2017 will reach 65 GW.
Coincidently, the unavoidable burden expands also. The cumulative cost burden for 20 years could be JPY56 trillion if all of the approved 87 GW (of which 79.9 GW is solar PVs) by the end of March 2016 become operational. This is equivalent to an increase of JPY3,200/MWh above the rates in place just before FIT started – an increase of 14% for households and 19% for industrial consumers.
CO2 emissions | Reduce for the fourth consecutive year through FY2017, 11.4% lower than FY2013 level
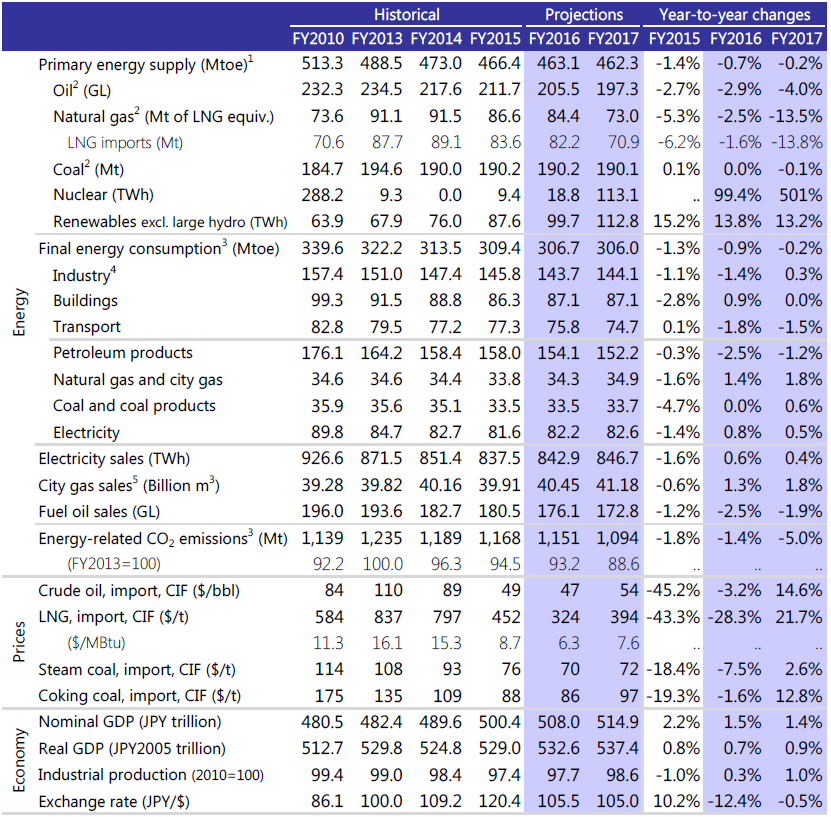
Energy-related CO2 emissions reached a historical high of 1,235 Mt-CO2 in FY2013 but will decrease for the fourth consecutive year through FY2017. The energy saving and the restart of nuclear power plants combined with the increase in renewable energy will considerably diminish oil and natural gas consumption, lowering the emission by 141 Mt-CO2 to 1,094 Mt-CO2 in FY2017. While the GOJ sets the Nationally Determined Target of 26% for GHG emissions reduction (25% for CO2) from 2013 by 2030 as an international commitment, CO2 emissions in FY2017 will be 11.4% less than in FY2013. The main contributions for the emissions reduction come from the re-starts of nuclear power generation (40%) and from the increase in renewable energy (20%).
Table 1 | Summary of Reference Scenario

Notes:
1. Mtoe = 1013 kcal
2. Conversion factors for Oil: 9,126 kcal/L; Natural gas: 13,043 kcal/kg; Steam coal: 6,139 kcal/kg; Coking coal: 6,928 kcal/kg until FY2012.
Conversion factors for Oil: 9,145 kcal/L; Natural gas: 13,141 kcal/kg; Steam coal: 6,203 kcal/kg; Coking coal: 6,877 kcal/kg since FY2013.
3. Final energy consumption and CO2 emissions in FY2015 are estimation.
4. Industry includes non-energy use.
5. Conversion factor: 1 m3 = 10,000 kcal
Table annex | Impacts of restarting nuclear power plants

Reference Scenario: Seven nuclear power plants restart by the end of FY2016.
About one plant restarts every month in FY2017 and 19 plants in total restart by the end of FY2017.
Low Case: Five nuclear power plants restart by the end of FY2016
About 0.5 plant restarts every month in FY2017 and 12 plants in total restart by the end of FY2017.
High Case: Nine nuclear power plants restart by the end of FY2016
About 1.5 plants restart every month in FY2017 and 25 plants in total restart by the end of FY2017.
Best Mix Case: A hypothetical case reflecting the power generation mix (22%-24% of renewables, 20%-22% of nuclear, etc.)
in the Long-term Energy Supply and Demand Outlook by METI (2015).
1. Thirty-nine reactors operated at the end of 2010.
2. Sum of fuel cost, FIT purchasing cost and grid stabilising cost divided by total power generation.
Source: The Institute of Energy Economics, Japan
By : IEEJ


